
Economy and Market Cycles
School 04 — Security Analysis and Portfolio Design
Listen — 15-second overview
A quick spoken preview of this class
School 5 · Security Analysis and Portfolio Design · About 15 minutes
A great company can still have a rough year when the economy around it is struggling — and a mediocre company can look like a genius pick when the economy is booming. The economy is the weather; individual companies are the boats. A skilled sailor still watches the sky. We will now teach you about the business cycle, inflation and interest rates, the cycle's vital signs, and how to use all of this without ever trying to time the market.
The Economic Weather: Why Macro Matters to Stock Pickers
Most stock analysis zooms in on one company at a time — its products, its profits, its management. That zoomed-in view matters enormously, and this school spends most of its time there. But every company sails in the same ocean, and that ocean rises and falls in a pattern called the business cycle: the economy's repeating rhythm of growth and contraction.
Think of it as tide versus boat. In a rising tide, even leaky boats float. During a strong expansion, customers spend freely, companies hire, and profits grow across the board — so almost any decent stock can do well. In a recession, spending shrinks, layoffs spread, and profits fall — so even wonderful companies can see their stock prices sink for a while.
None of this changes whether a business is good or bad. A great business stays great in a recession; it just gets cheaper, which is actually good news for a patient buyer. But ignoring the weather means you can misjudge your timing and your expectations. If you buy stocks expecting every year to feel like a boom, the first contraction will shake you out of good investments at the worst possible moment. Understanding the cycle keeps you calm when the sky darkens.
Growth and the Business Cycle
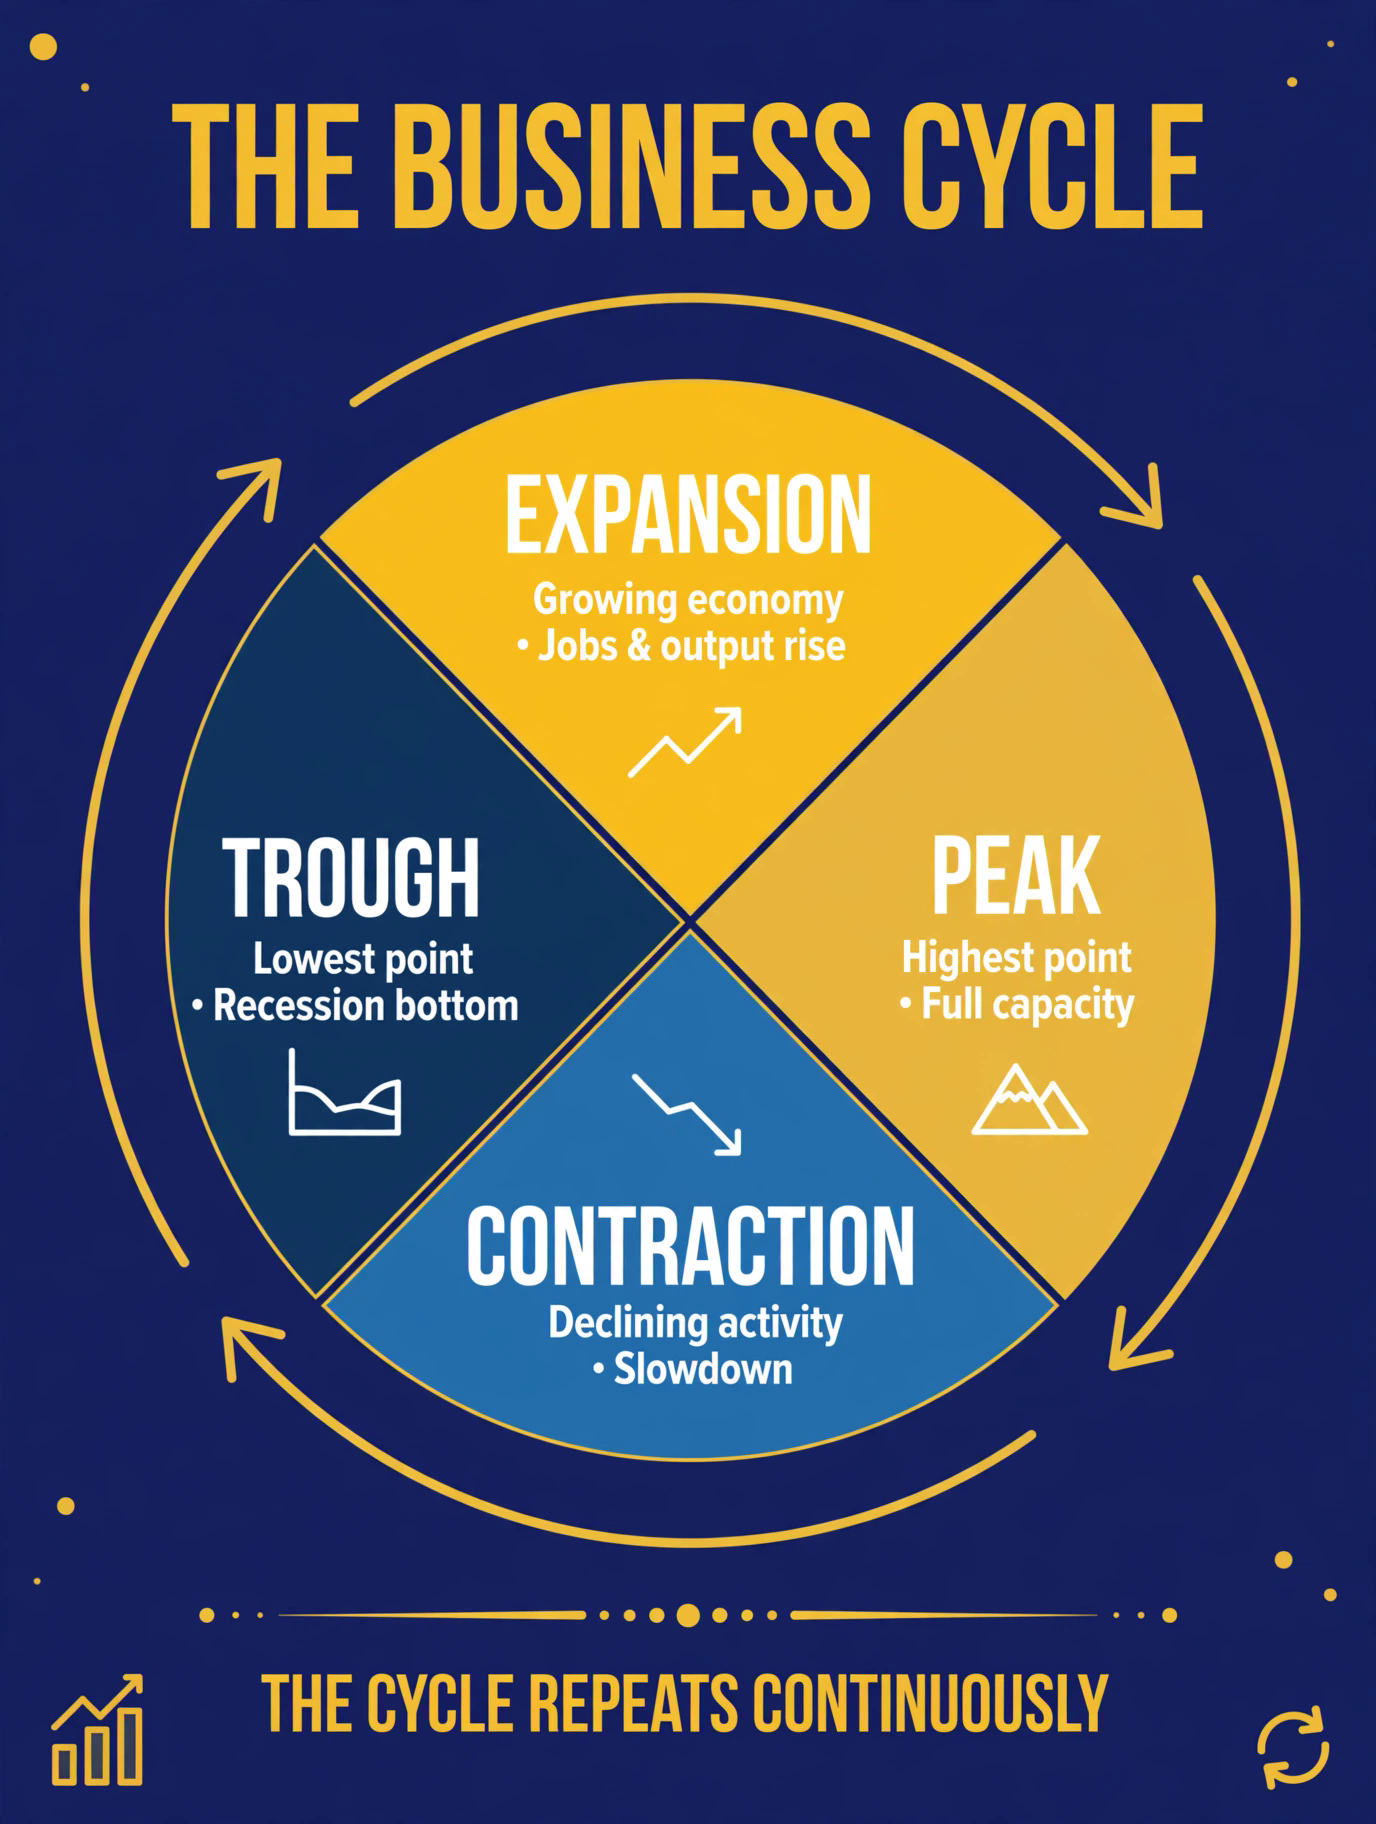
The business cycle has four phases, and they always arrive in the same order — like seasons.
In expansion, the economy is growing: people are spending, businesses are hiring, and corporate profits are rising. Jobs are easy to find, wages creep up, and optimism spreads. This is the phase when stock markets usually do their best work, because rising profits are what stock prices follow over time.
At the peak, growth hits its high point. Everything looks wonderful — unemployment is low, profits are strong, and confidence is sky-high. Peaks are dangerous precisely because they feel so safe: this is when people pay the highest prices and take the most risk, forgetting that the cycle always turns.
Then comes contraction: growth slows, then shrinks. Customers pull back, companies cut costs, layoffs begin, and profits fall. When a contraction is deep and long enough, economists call it a recession — a sustained downturn in economic activity. Stock prices usually fall during contractions, sometimes sharply, because falling profits make each share worth less.
Finally, the trough: the low point. The news is terrible, fear is everywhere, and nobody wants to buy stocks. Yet the trough is where the next expansion quietly begins. Growth resumes, and the cycle starts again. Expansions have historically lasted much longer than contractions — which is why patient, long-term investors have done so well — but nobody can predict exactly when any phase will end.
Inflation and Interest Rates
Inflation is the slow erosion of money's buying power: prices rising over time. A little inflation — around 2% a year — is normal and healthy; it means the economy is humming. Runaway inflation, where prices surge month after month, is destructive: savings melt, businesses cannot plan, and everyday life gets harder. Economists track it mainly through the CPI (Consumer Price Index), which measures the price of a basket of everyday goods and services.
The main institution fighting inflation is the Federal Reserve — the Fed for short — America's central bank. Its most powerful tool is the interest rate: the price of borrowing money. When inflation runs too hot, the Fed raises rates; borrowing gets expensive, spending cools, and inflation settles. When the economy stalls, the Fed cuts rates; borrowing gets cheap, spending revives, and growth returns. One lever, pushed in both directions.
Here is why this matters so much to stock prices. A stock is worth, roughly, what its future profits are worth to you today. But a dollar of profit ten years from now is worth less than a dollar today — you have to discount it, because you could have invested today's dollar and grown it. Higher interest rates mean a steeper discount: future profits get marked down more, so stocks are worth less right now. Lower rates mean a gentler discount, lifting stock prices.
This is the single most important piece of market weather. When rates rise, almost all stocks face a headwind — especially fast-growing companies whose profits sit far in the future. When rates fall, almost all stocks get a tailwind. You do not need to predict the Fed's next move; you just need to understand that rates are the gravity pulling on every stock price.
Reading the Cycle's Vital Signs
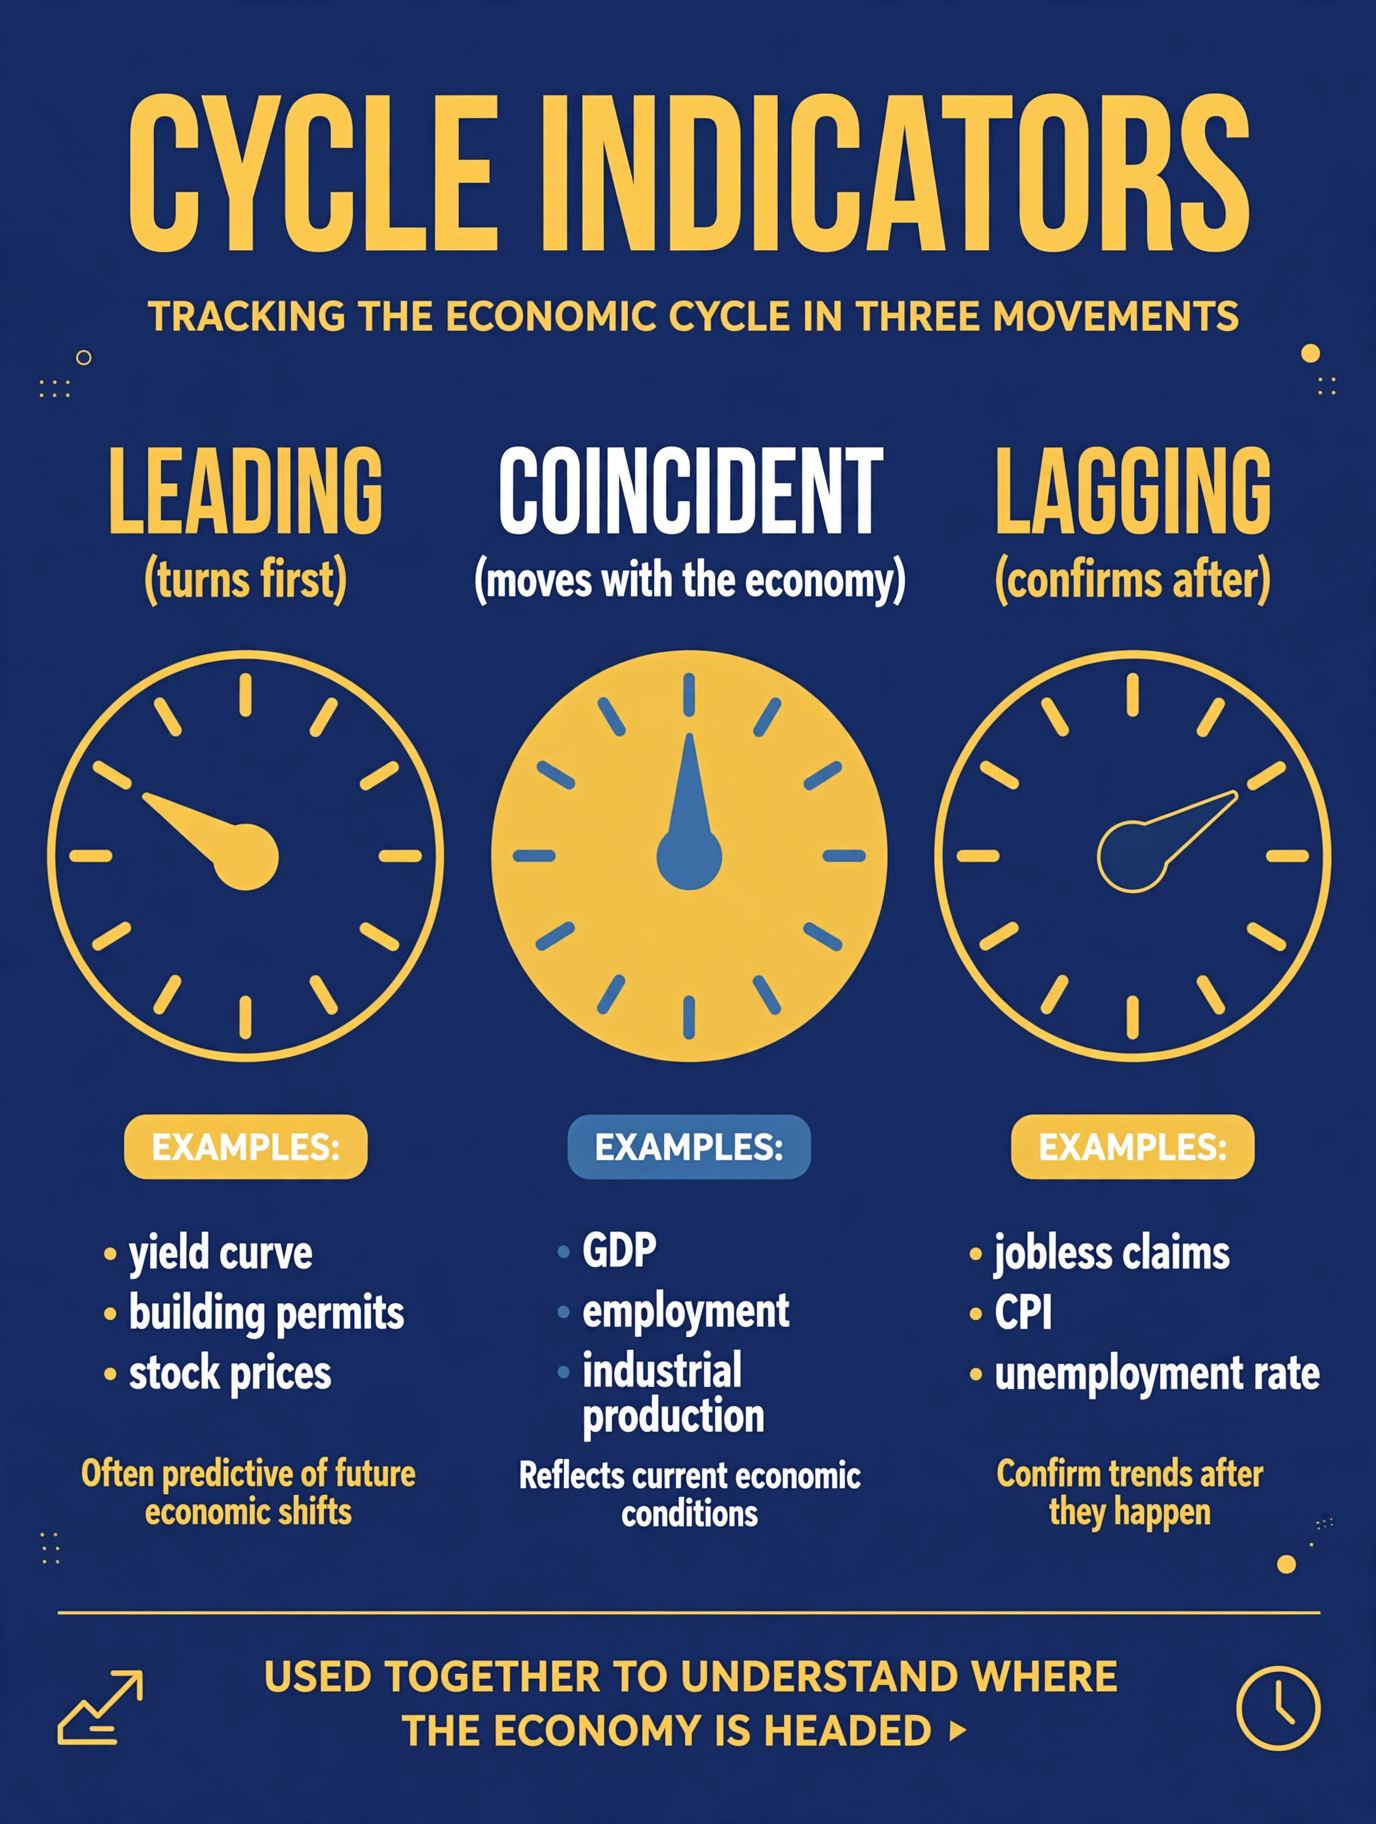
You cannot predict the cycle, but you can read it — like checking a patient's vital signs. Five indicators tell you most of what you need to know.
Labor and unemployment. Jobs are the economy's pulse. When unemployment is very low and wages are rising fast, the economy is running hot — often near a peak. When layoffs are spreading and unemployment is climbing, a contraction is usually underway. Jobs are a lagging indicator: they confirm where the economy has been more than where it is going, because companies hire and fire slowly.
Inflation (CPI). Rising inflation readings tell you prices are accelerating — often late in an expansion, and a signal that the Fed may raise rates. Falling inflation tells you the economy is cooling. Inflation is also mostly lagging: it describes what already happened to prices.
Credit conditions. Healthy companies borrow constantly, and the extra interest they pay over safe government bonds is called the credit spread. Narrow spreads mean lenders feel confident — good times. Widening spreads mean lenders are scared and charging more for risk — a warning that trouble may be coming. Credit spreads are a leading indicator: they often move before the broader economy turns.
Liquidity. Liquidity means money flowing freely through the financial system — banks lending, investors buying, cash easy to come by. High liquidity lifts asset prices; drying liquidity drags them down. When credit tightens and cash gets scarce, even good companies can struggle to fund themselves. Watch whether money is flowing or freezing.
The yield curve. Bonds pay different interest rates depending on how long you lend. Normally, lending for ten years pays more than lending for three months — you demand extra for waiting. But sometimes short-term rates rise above long-term rates, and the curve is said to be inverted. Here is the one simple sentence to remember: when short rates rise above long rates, it has often warned of recessions ahead — because it means investors expect the Fed to cut rates in the future to fight a downturn.
What to Do with All This
Now the honest warning: none of this lets you time the market. Economists with supercomputers cannot reliably predict recessions, and you will not either. Anyone who claims they can is selling something. The cycle is for adjusting your expectations, not for jumping in and out of stocks.
Here is how a cycle-aware investor actually behaves. In late expansions — when everyone is euphoric and prices are high — you demand a bigger margin of safety: you pay less for each dollar of profit, keep more cash on hand, and avoid the riskiest bets. In contractions — when fear is everywhere and prices are low — you do the opposite: you recognize that great businesses are on sale, and you buy carefully while others panic.
This is the difference between leading and lagging indicators in practice. Leading indicators (credit spreads, the yield curve) hint at what is coming, so they shape your caution. Lagging indicators (unemployment, CPI) confirm what already happened, so they keep you from panicking at headlines about the past. You use the cycle the way a sailor uses a weather report: not to control the ocean, but to set the sails wisely and never be surprised by a storm.
Key terms
- Business cycle
- the economy's repeating rhythm of expansion, peak, contraction, and trough.
- Expansion
- the phase when the economy grows: spending, hiring, and profits all rise.
- Peak
- the high point of growth, when conditions look best and risk is often highest.
- Contraction
- the phase when economic activity shrinks: spending falls, layoffs spread, profits decline.
- Trough
- the low point of the cycle, where the next expansion quietly begins.
- Recession
- a deep, sustained contraction in economic activity.
- Inflation
- the slow erosion of money's buying power as prices rise over time.
- CPI (Consumer Price Index)
- the main measure of inflation, tracking a basket of everyday goods and services.
- Interest rate
- the price of borrowing money; the Fed's main lever for steering the economy.
- Federal Reserve (the Fed)
- America's central bank, which sets short-term interest rates to balance growth and inflation.
- Liquidity
- how freely money flows through the financial system; high liquidity lifts asset prices.
- Credit spread
- the extra interest risky borrowers pay over safe government bonds; widening spreads signal fear.
- Yield curve
- the pattern of interest rates across short- and long-term lending.
- Inverted yield curve
- when short-term rates rise above long-term rates; it has often warned of recessions ahead.
- Leading indicator
- a signal that tends to move before the economy turns, like credit spreads and the yield curve.
- Lagging indicator
- a signal that confirms where the economy has been, like unemployment and inflation.
What's next
With the economic weather readable, AP-202 "Read Financial Statements" opens the company's books — the income statement, balance sheet, and cash flow statement.
The quiz
Economy and Market Cycles — Quiz
3 questions · pass with 3 correct
1.In what order do the four phases of the business cycle arrive?
2.What does an inverted yield curve mean?
3.How should a cycle-aware investor actually use knowledge of the business cycle?